How Competitive are Legislative Elections?
When looking at any election result, and trying to determine how competitive, or "how close" the election was, most observers look at two data-points: (1) how many seats (or races) each party won; and (2) what the percentage of victory was in each individual race. One of the challenges to using the first method is that it only gives a "macro"-level view: for example, we could observe that the Republican Party has a 71-23 seat advantage in the North Dakota House, while only having a 72-62 seat advantage in the Minnesota House. Does this mean the Democratic Party is more competitive in legislative elections in Minnesota? One would be tempted to assume that; however, in both states, the Democratic didn't even field candidates in multiple House races (8 of 67 in Minnesota; 12 of 48 in North Dakota; the Republicans also left some races uncontested: 4 House seats in North Dakota, and 1 in Minnesota, had no GOP candidate).
Most Political Scientists have thus shifted to looking at district-level competitiveness instead, following Tidmarch, Lonergan, and Sciortino's (1986) method of looking at the margin of victory within each district, and then tallying how many districts each party holds at each level of competitiveness. Measuring competitiveness then becomes rather simple in a single-member district state like Minnesota (for examples of data from the 2012 and 2014 elections, the Minnesota Secretary of State's office offers some useful maps here (2012) and here (2014). If we use the three ranges noted on the SOS map for the 2014 House races, we see the following breakdown:
Most Political Scientists have thus shifted to looking at district-level competitiveness instead, following Tidmarch, Lonergan, and Sciortino's (1986) method of looking at the margin of victory within each district, and then tallying how many districts each party holds at each level of competitiveness. Measuring competitiveness then becomes rather simple in a single-member district state like Minnesota (for examples of data from the 2012 and 2014 elections, the Minnesota Secretary of State's office offers some useful maps here (2012) and here (2014). If we use the three ranges noted on the SOS map for the 2014 House races, we see the following breakdown:
| GOP control | Dem control | |
|---|---|---|
| Highly Competitive (5% or less margin) | 6 (8.3%) | 10 (16.1%) |
| Somewhat Competitive (5-15% margin) | 20 (27.7%) | 7 (11.3%) |
| Non-Competitive (15% or higher margin) | 46 (63.8%) | 45 (72.5%) |
| Totals | 72 | 62 |
The percentage in each cell represents the percentage of seats held by that party which fall under each classification. Thus, what we see is that in the Highly Competitive districts, the Democrats did perform slightly better (10 seats compared to 6); however, there are only 43 seats (out of 134) which are not already "safe" for one party or the other (91 of 134, or 67.9%, of the total seats, had a margin of victory of more than 15%). Thus, there are large areas of the state which are dominated by one party (the urban areas of the Twin Cities and the Iron Range for the Democrats; Central and Southern Minnesota, as well as a far-exurban areas of the Twin Cities for the Republicans). Thus, the two parties end up competing only in relatively few areas around the state (particularly the near suburbs and a few areas of southeastern Minnesota).
A similar picture emerges in the Minnesota Senate, although the number of non-competitive districts was lower in 2012 (remember that all Minnesota Senators are elected at the same time, for four-year terms, so 2012, which was also a Presidential election year [with the higher turnout that accompanies that race], is the last year for which we have data). There were 24 "safe" Democratic seats in the Senate that year, but only 10 with Republican margins of 15% or higher. Sixteen (16) of the remaining 18 Republican seats came from "Somewhat Competitive" districts, while only 2 were won with margins of less than 5%. Democrats won 5 seats in those "Highly Competitive" races, and 10 in the middle category (5-15%).
A similar picture emerges in the Minnesota Senate, although the number of non-competitive districts was lower in 2012 (remember that all Minnesota Senators are elected at the same time, for four-year terms, so 2012, which was also a Presidential election year [with the higher turnout that accompanies that race], is the last year for which we have data). There were 24 "safe" Democratic seats in the Senate that year, but only 10 with Republican margins of 15% or higher. Sixteen (16) of the remaining 18 Republican seats came from "Somewhat Competitive" districts, while only 2 were won with margins of less than 5%. Democrats won 5 seats in those "Highly Competitive" races, and 10 in the middle category (5-15%).
Competitiveness in North Dakota
Using a similar measure in North Dakota, with its Multi-member House districts, is much more complicated. If we only wanted to look at competitiveness in the Senate, this would be somewhat easy, since those members are elected in single-member elections. However, there's another complicating factor: North Dakota legislative campaigns tend to be waged as "team efforts". That is, in any given district, the three Republican candidates (two for House, one for the Senate seat) tend to advertise and campaign as a group ticket; and the three Democratic candidates generally do the same. Also, the Senate and House constituencies in Minnesota are distinct districts (each Senate district is divided into two separate House districts); whereas in North Dakota districts, the three officeholders all represent exactly the same voters.
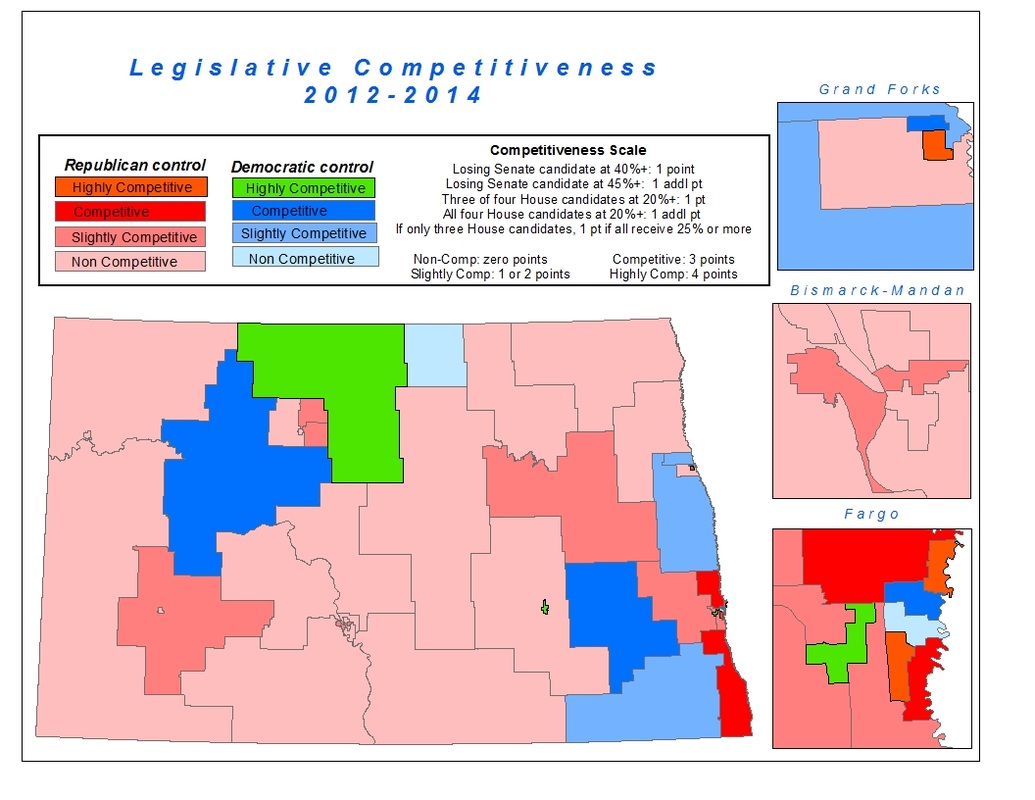
Using a method of "scaling" the competitiveness of districts (suggested by Niemi, Jackson, and Winsky [1991]), I have constructed a scale that indicates how "close" the most recent legislative elections were in that district. The measure is summarized on the map below: essentially, each district is scored on a scale of zero (0) to four (4) points: districts where the losing Senate candidate earned less than 40%, and both losing House candidates less than 20% (the Secretary of State calculates percentages in House races on a "total votes cast" basis), earned no points. A district, by contrast, where the losing Senate candidate gained at least 45% in that race; and all four House candidates scored above the 20% threshold, would earn all four (4) available points. In cases where there was split control (both parties holding at least one legislative seat), the party which held the larger number of seats was considered the "party in control" (many of the "Highly Competitive" and "Competitive" districts are split districts; however, there is one outlier: District 35, in central Bismarck, is considered "Slightly Competitive" according to this scale, but only the two House seats are held by the Republicans [newly elected Senator Erin Oban, a Democrat, defeated the incumbent Republican by a healthy 57%-43% margin]). Here are the total number of districts within each category:
Using a method of "scaling" the competitiveness of districts (suggested by Niemi, Jackson, and Winsky [1991]), I have constructed a scale that indicates how "close" the most recent legislative elections were in that district. The measure is summarized on the map below: essentially, each district is scored on a scale of zero (0) to four (4) points: districts where the losing Senate candidate earned less than 40%, and both losing House candidates less than 20% (the Secretary of State calculates percentages in House races on a "total votes cast" basis), earned no points. A district, by contrast, where the losing Senate candidate gained at least 45% in that race; and all four House candidates scored above the 20% threshold, would earn all four (4) available points. In cases where there was split control (both parties holding at least one legislative seat), the party which held the larger number of seats was considered the "party in control" (many of the "Highly Competitive" and "Competitive" districts are split districts; however, there is one outlier: District 35, in central Bismarck, is considered "Slightly Competitive" according to this scale, but only the two House seats are held by the Republicans [newly elected Senator Erin Oban, a Democrat, defeated the incumbent Republican by a healthy 57%-43% margin]). Here are the total number of districts within each category:
| GOP control | Dem control | |
|---|---|---|
| Highly Competitive | 3 (8.5%) | 3 (25%) |
| Competitive | 3 (8.5%) | 4 (33.3%) |
| Slightly Competitive | 9 (25.7%) | 3 (25%) |
| Non Competitive | 20 (57.1%) | 2 (16.7%) |
| Totals | 35 | 12 |
The contrast with Minnesota is striking. First of all, not only do the Republicans have over-whelming majorities in both chambers (71-23 in the House, and 32-15 in the Senate), the difference in Non-Competitive districts is quite vast: the Republicans are generally "safe" in most of the western and northeastern parts of the state; the only solidly Democratic territory (either "Non-Competitive" or "Slightly Competitive") are in counties containing Native American reservations and certain areas of the Red River Valley. In the remainder of the Valley, both parties are still competitive.