Legislative Polarity
Students of congressional and legislative voting behavior have long been interested in questions about partisanship and the role of ideology in understanding why and how legislators vote the way that they do. Traditional understandings of political party structures, particularly the "cadre" parties that tend to dominate in the United States (as opposed to the "ideological" parties more commonly found in Parliamentary systems in Europe), have assumed that American parties are coalitions of diverse interests, and that wide variety in issue stances can be found amongst the office-holders in each party. A basic assumption about such party systems has held that national or state-wide party platforms are treated as broad statements of principles, but that each candidate for public office will shape his or her campaign and legislative approach (if elected) based upon the demographic, cultural, and ideological makeup of his or her local constituency. Studies of Congress, however, especially since the end of the Vietnam War, have emphasized the increasing "polarization" of the party caucuses in both the House and Senate. "Polarization" has generally been understood to mean the degree to which legislators of one party tend to vote in "blocs" with members of their same party identification, and in opposition to the members of the other party. Keith Poole and Howard Rosenthal are the best-known Political Scientists in terms of studying (and particularly quantifying) this phenomenon. By applying sophisticated statistical techniques to the voting records of individual Congressman and Senators, and then comparing their votes on every contested roll-call (they use a standard whereby every vote in which 2.5% or more of the membership disagreed with the outcome is considered "contested"), Poole and Rosenthal have been able to quantify the ideological voting behavior of individual members, as well as identify historical periods and trends in which party and ideological blocs have tended to show larger and smaller degrees of polarization.
However, in the field of state legislative politics, similar work was long lacking. A basic challenge has been the difficulty of collecting common data. Congressional roll-call votes can generally be found in a single location (the respective Clerk's offices, and now websites, of each of the two chambers). However, with 50 states, and 99 legislative chambers (Nebraska being the one state with a unicameral body), the task of collecting roll call votes from each state (especially since some states didn't put voting records or House/Senate Journals online until the mid-2000s) was especially daunting. A few short-lived projects in the previous decade attempted to create some common electronic voting repositories, using scanning software and scripts to create large databases of individual votes. Another challenge was comparisons across the states. Any casual observer of state politics expects that a Grand Forks Republican to probably have some different attitudes about public policy issues than those of a Republican from Mott or Rugby. However, both of those office-holders would most likely have more "conservative" views than those of a Republican in the New York State Assembly or the Pennsylvania Senate, especially one from a suburban area. By the same token, the average Massachusetts Democrat is likely to be much more "liberal" than the average Democratic legislator in Alabama. However, since each state deals with distinct legislative agendas (oftentimes geared toward state-specific issues), there are few (if any) common roll-call votes that one could point to which would make for easy comparison across state boundaries. In 2011, Boris Shor and Nolan McCarty published an article in the American Political Science Review which made a major breakthrough in this field. Working with a consortium of several universities, Shor and McCarty were able to collect, scan, and collate the voting records of state legislators from all fifty states for the period 1993-2009 (Shor continues to maintain and update the datasets at the American Legislatures website (however, the most current [June 2014] version does not yet include 2013 session votes for North Dakota). Using the responses to a common questionnaire sent to all state legislative candidates by Project Vote Smart, Shor and McCarty were also able to "bridge" responses by candidates from different states, and thus have a way to compare the differences in ideological attitudes between legislators from the same party across states.
However, as mentioned above, the Shor and McCarty data, while valuable, does have two distinct limitations for the student of state politics who is trying to understand the ideological or partisan divisions in a currently-meeting legislative session. The first is that for each legislator, the "ideology" (or np_score, as Shor and McCarty call it) is an aggregate score over that legislator's entire career. For long-time members, such as Senator Holmberg or Representative Martinson, these scores are informed not just by today's issues and the current partisan makeup of the Legislature; they go all the way back to the early 90's, when the partisan makeup of each chamber was vastly different (and the issues were distinct). The second issue, as mentioned above, is that, at least for North Dakota, the 2013 session votes haven't been included yet, so any legislator elected for the first time in 2012 or 2014 does not yet appear in the data.
In an attempt to replicate some form of this measure, I have constructed a much simpler (and admittedly much less robust) data set for the current (2015) session. Using roll call votes for all contested floor measures (for the purposes of this measure, I used a ten-percent threshold, where any House vote in which nine or more [out of 94] was considered contested [for the Senate, that number is five or more, out of 47 Senators]. For each member, I calculated the percentage by which his or her vote agreed with that of every other member of the chamber. Then, for each member, I took the average percentage for which his/her vote agreed with the members of his/her own party, and then a separate percentage for which they agreed with the members of the opposite party. The standard scale used in most ideology/partisan studies uses +1 to represent the most polarized (or partisan) Republican/conservative position, and a -1 for the most polarized (or partisan) Democrat/liberal position. I should be clear: given the way that I have constructed this, it is strictly a partisan scale, not an ideological one (the latter would require a much more robust analysis and a considerably larger amount of data and computing power). In a perfectly polarized legislative body, where every vote fell strictly along party lines, every Republican would show a +1 score, and every Democrat would show a -1 score.
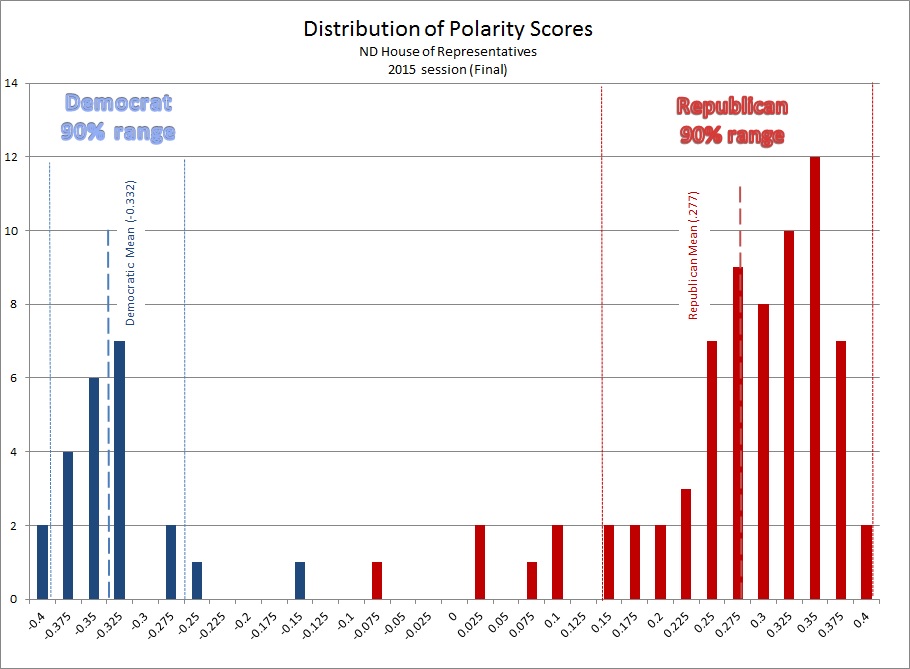
The following chart and table show these percentages of agreement for contested roll-calls in the House only, through the end of the 2015 session. In all, the House took 982 roll-call votes, of which 464 involved a contested minority of ten percent or more (9 members out of 94). Thus, the votes analyzed here represent 47.25% of all of the votes cast during the 2015 session.
Students of congressional and legislative voting behavior have long been interested in questions about partisanship and the role of ideology in understanding why and how legislators vote the way that they do. Traditional understandings of political party structures, particularly the "cadre" parties that tend to dominate in the United States (as opposed to the "ideological" parties more commonly found in Parliamentary systems in Europe), have assumed that American parties are coalitions of diverse interests, and that wide variety in issue stances can be found amongst the office-holders in each party. A basic assumption about such party systems has held that national or state-wide party platforms are treated as broad statements of principles, but that each candidate for public office will shape his or her campaign and legislative approach (if elected) based upon the demographic, cultural, and ideological makeup of his or her local constituency. Studies of Congress, however, especially since the end of the Vietnam War, have emphasized the increasing "polarization" of the party caucuses in both the House and Senate. "Polarization" has generally been understood to mean the degree to which legislators of one party tend to vote in "blocs" with members of their same party identification, and in opposition to the members of the other party. Keith Poole and Howard Rosenthal are the best-known Political Scientists in terms of studying (and particularly quantifying) this phenomenon. By applying sophisticated statistical techniques to the voting records of individual Congressman and Senators, and then comparing their votes on every contested roll-call (they use a standard whereby every vote in which 2.5% or more of the membership disagreed with the outcome is considered "contested"), Poole and Rosenthal have been able to quantify the ideological voting behavior of individual members, as well as identify historical periods and trends in which party and ideological blocs have tended to show larger and smaller degrees of polarization.
However, in the field of state legislative politics, similar work was long lacking. A basic challenge has been the difficulty of collecting common data. Congressional roll-call votes can generally be found in a single location (the respective Clerk's offices, and now websites, of each of the two chambers). However, with 50 states, and 99 legislative chambers (Nebraska being the one state with a unicameral body), the task of collecting roll call votes from each state (especially since some states didn't put voting records or House/Senate Journals online until the mid-2000s) was especially daunting. A few short-lived projects in the previous decade attempted to create some common electronic voting repositories, using scanning software and scripts to create large databases of individual votes. Another challenge was comparisons across the states. Any casual observer of state politics expects that a Grand Forks Republican to probably have some different attitudes about public policy issues than those of a Republican from Mott or Rugby. However, both of those office-holders would most likely have more "conservative" views than those of a Republican in the New York State Assembly or the Pennsylvania Senate, especially one from a suburban area. By the same token, the average Massachusetts Democrat is likely to be much more "liberal" than the average Democratic legislator in Alabama. However, since each state deals with distinct legislative agendas (oftentimes geared toward state-specific issues), there are few (if any) common roll-call votes that one could point to which would make for easy comparison across state boundaries. In 2011, Boris Shor and Nolan McCarty published an article in the American Political Science Review which made a major breakthrough in this field. Working with a consortium of several universities, Shor and McCarty were able to collect, scan, and collate the voting records of state legislators from all fifty states for the period 1993-2009 (Shor continues to maintain and update the datasets at the American Legislatures website (however, the most current [June 2014] version does not yet include 2013 session votes for North Dakota). Using the responses to a common questionnaire sent to all state legislative candidates by Project Vote Smart, Shor and McCarty were also able to "bridge" responses by candidates from different states, and thus have a way to compare the differences in ideological attitudes between legislators from the same party across states.
However, as mentioned above, the Shor and McCarty data, while valuable, does have two distinct limitations for the student of state politics who is trying to understand the ideological or partisan divisions in a currently-meeting legislative session. The first is that for each legislator, the "ideology" (or np_score, as Shor and McCarty call it) is an aggregate score over that legislator's entire career. For long-time members, such as Senator Holmberg or Representative Martinson, these scores are informed not just by today's issues and the current partisan makeup of the Legislature; they go all the way back to the early 90's, when the partisan makeup of each chamber was vastly different (and the issues were distinct). The second issue, as mentioned above, is that, at least for North Dakota, the 2013 session votes haven't been included yet, so any legislator elected for the first time in 2012 or 2014 does not yet appear in the data.
In an attempt to replicate some form of this measure, I have constructed a much simpler (and admittedly much less robust) data set for the current (2015) session. Using roll call votes for all contested floor measures (for the purposes of this measure, I used a ten-percent threshold, where any House vote in which nine or more [out of 94] was considered contested [for the Senate, that number is five or more, out of 47 Senators]. For each member, I calculated the percentage by which his or her vote agreed with that of every other member of the chamber. Then, for each member, I took the average percentage for which his/her vote agreed with the members of his/her own party, and then a separate percentage for which they agreed with the members of the opposite party. The standard scale used in most ideology/partisan studies uses +1 to represent the most polarized (or partisan) Republican/conservative position, and a -1 for the most polarized (or partisan) Democrat/liberal position. I should be clear: given the way that I have constructed this, it is strictly a partisan scale, not an ideological one (the latter would require a much more robust analysis and a considerably larger amount of data and computing power). In a perfectly polarized legislative body, where every vote fell strictly along party lines, every Republican would show a +1 score, and every Democrat would show a -1 score.
The following chart and table show these percentages of agreement for contested roll-calls in the House only, through the end of the 2015 session. In all, the House took 982 roll-call votes, of which 464 involved a contested minority of ten percent or more (9 members out of 94). Thus, the votes analyzed here represent 47.25% of all of the votes cast during the 2015 session.
|
|
|
|
A couple of notes of caution. Remember that these scores represent RELATIVE PARTISANSHIP, NOT IDEOLOGY. The higher the absolute value (distance from zero), the more likely it was that, on an given vote, the member was more likely to vote the same as the other members of his or her party. The number is the DIFFERENCE in percentages of partisan agreement. No score is given for Rep. Robert Frantsvog, who was absent for the majority of the contested votes during this period.
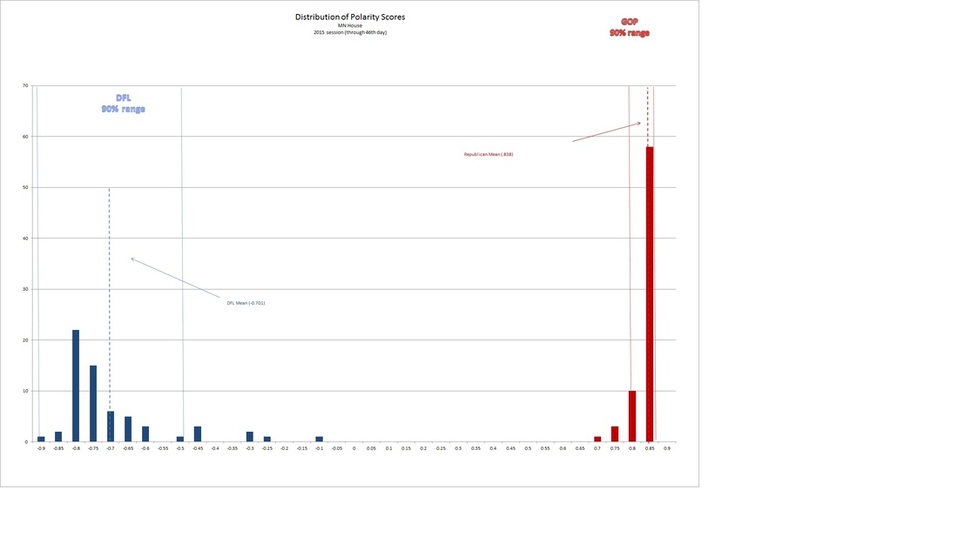
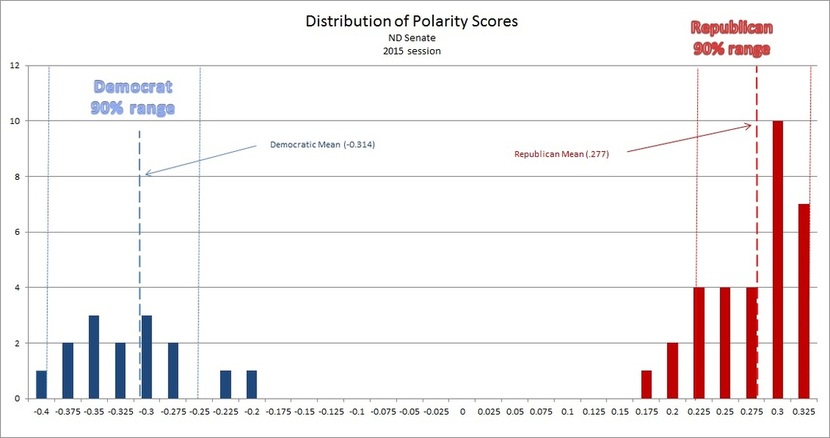
The image below shows the distribution of scores (with separate means for each party caucus, as well as indications for the 90% distribution [a Standard Deviation of 1.34 above and below the mean). Notice that all of the Republican outliers are towards the middle of range, whereas the Democratic outliers fall on both sides of the party caucus range). Although some participants in the legislative system seem to believe that there is a high degree of partisanship in the House, when compared to other states, there is a high amount of crossing-over and coalitioning, especially amongst certain sub-groups within the Republican caucus. Even the most "highly partisan" members at the extremes of each end in the North Dakota House only voted with their own caucus members about 40% more often than with those of the opposite party (see the discussion of Minnesota's House below, as well as the Shor/McCarty data referenced there, for examples of much more highly polarized legislatures, where the differences are closer to 70-80% [or more]).
The image below shows the distribution of scores (with separate means for each party caucus, as well as indications for the 90% distribution [a Standard Deviation of 1.34 above and below the mean). Notice that all of the Republican outliers are towards the middle of range, whereas the Democratic outliers fall on both sides of the party caucus range). Although some participants in the legislative system seem to believe that there is a high degree of partisanship in the House, when compared to other states, there is a high amount of crossing-over and coalitioning, especially amongst certain sub-groups within the Republican caucus. Even the most "highly partisan" members at the extremes of each end in the North Dakota House only voted with their own caucus members about 40% more often than with those of the opposite party (see the discussion of Minnesota's House below, as well as the Shor/McCarty data referenced there, for examples of much more highly polarized legislatures, where the differences are closer to 70-80% [or more]).
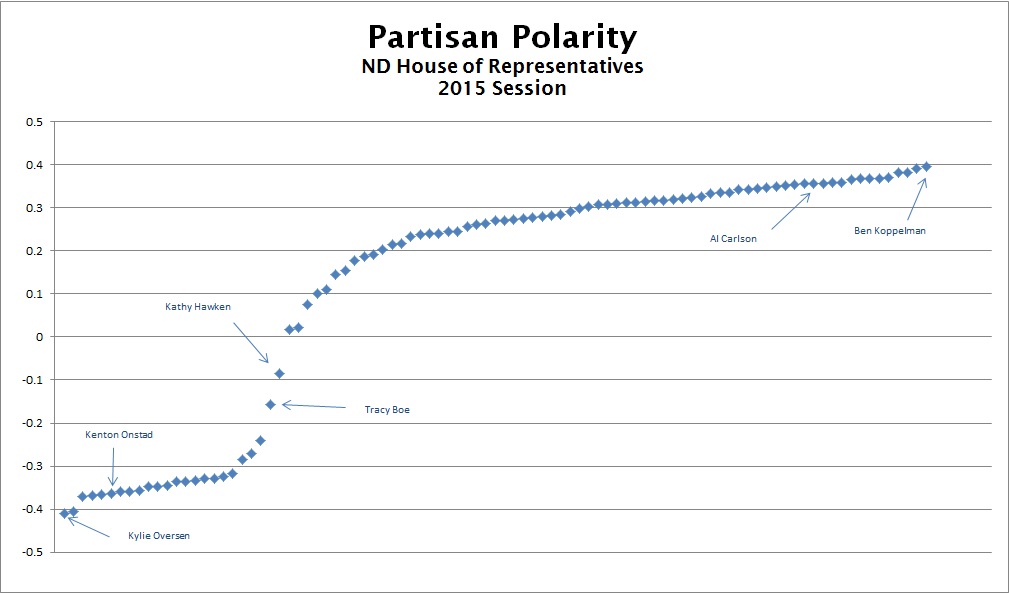
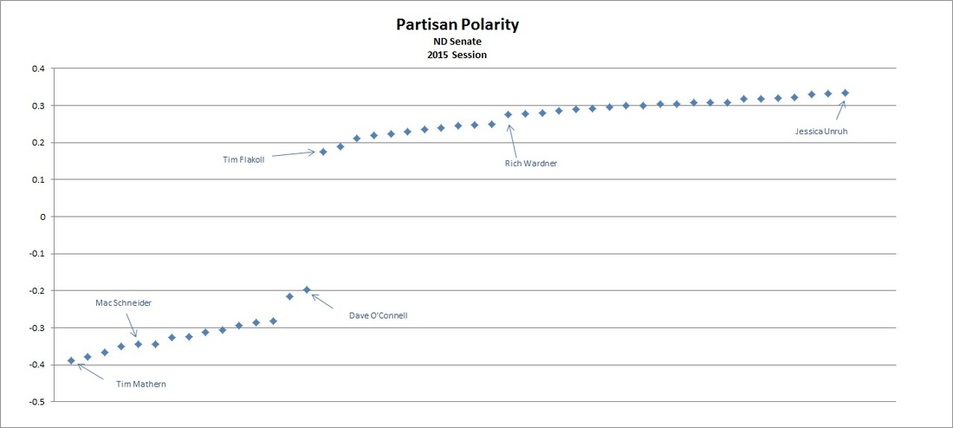
Polarity in the North Dakota Senate
In the Senate, there were fewer overall roll-call votes (850), and also a much smaller number (and percentage) of contested roll-call votes. Like with the House calculation, a vote was considered "contested" if at least 10% of the Senators (5 out of 47) voted against the prevailing side. There were 210 such votes, which means that only 24.7% of the roll-call votes garnered even a small amount of opposition (compare this to the 53.5% rate of contested votes in the House prior to crossover, and the 47.25% for the entire session).
|
|
|
As the distribution graph shows below, the "outliers" within each party range are much less significant than in the House (there are no Senators who "crossed over" into agreement with the other party in the majority of votes; however, remember that there is a much higher degree of unanimous or near-unanimous agreement in the Senate, so opportunities to cross over, or to distinguish one's self at the margins of the party range, were much less prevalent).
"Levels of Agreement" among House members
Observers of North Dakota legislative elections are aware of the "multi-member" system: in North Dakota legislative districts, three members are actually elected from each Legislative District (one Senator and two House members). It is not uncommon in many legislative campaigns to see all three candidates from each party run together as a "team" for office, with billboards, pamphlets, yard signs, newspaper advertisements, etc, encouraging a vote for all three candidates.
So, once elected, do those "teams" of legislators act in similar ways? One possible avenue to investigate this question would be to look at roll-call voting records, and comparing how legislators from the same district voted on the same issues. With 464 contested roll calls in the House, we have a fairly extensive set of data by which to make these intra-district comparisons.
The two charts below show these "levels of agreement" for each pair of House members, in order from highest agreement to lowest. The first chart shows all of the districts in which both House members come from the same party; the second shows those districts in which one member is from each major political party. Republicans are indicated in RED; Democrats in BLUE.
Levels of Agreement amongst House members from same party
|
|
| ||||||||||||||||||||||||||||||||||||||||||||||||||||||||||||||||||||||||||||||||||||||||||||||||||||||||||||||||||||||||||||||||||||||||||||||||||||||||||||||||
*Representative Belter missed a significant numbers of votes due to health issues: this percentage is based only upon votes cast, so the sample size is much smaller than for other districts. District 40 was eliminated completely from these calculations, due to the health-related absence of Representative Bob Frantsvog for most of the session.
Levels of Agreement amongst House members from opposite parties
| District | Representatives | % Agreement | |
|---|---|---|---|
| 6 | Hunskor | D.Anderson | 62.69 |
| 25 | Schreiber Beck | Mitskog | 54.90 |
| 43 | Delmore | R.S.Becker | 53.18 |
| 24 | Muscha | Kiefert | 52.17 |
| 12 | Haak | Looysen | 48.88 |
| 44 | Thoreson | Boschee | 47.81 |
| 41 | Carlson | P.Anderson | 42.26 |
| 4 | Froseth | Onstad | 39.22 |
| 16 | B.Koppelman | Hanson | 30.70 |
So, why do these disparities exist? Some possible preliminary thoughts, all of which are part of the larger study which will be addressed further by my sabbatical research. One possibility is that in the districts with high levels of agreement amongst members from the same party, the incumbent party is relatively "safe" from competition from the opposite party, and the members are taking cues from the partisan makeup of the district electorate. Most of the Republican districts with 80% and higher levels of agreement are in the central and western parts of the state (see the "Legislative District Index" and "Legislative Competitiveness" pages to compare: most of those are high "R+" districts, and have low levels of competitiveness). The Democratic districts at 80% and above in levels of agreement are similar: they include three of the safest Democratic districts in urban Grand Forks and Fargo, as well as two of the highest "D+" districts in the rural east (using the LDPI scores from the "Legislative District Index" page). At the other end of the "same party" table, we see more competitive districts, especially with Republican incumbents. In addition, several of those districts are in suburban/exurban areas of Fargo or Bismarck, with rapidly changing demographics (47, 7, 45, 27, and 46 are all examples), so it's possible that the Representatives from those areas are responding to different sets of constituencies. There are also several instances at that end of the "same party" table where one member has a high level of seniority, and perhaps feels more comfortable voting against the party trend. Several of these hypotheses will be tested in coming weeks, as more data is collected.
In the bottom table, where members come from opposite parties, there aren't enough data points to really "test" a hypothesis, but several things do jump out. First, District 6 is relatively obvious: Rep. Bob Hunskor has the distinction of being the Democrat with the highest "R+" LDPI score in the House, so his relatively high level of agreement with the other (Republican) Representative from that district is not surprising. Two other districts (24 and 25) at the top of that table involve freshmen legislators who were elected on opposite tickets: it's very possible that, given their status as new legislators, they are still trying to discern their roles, and are likely responding to many of the same (or similar) constituent cues. In the bottom three districts on this table, two of them (Carlson in 41 and Onstad in 4) are the respective Majority and Minority Leaders, so it's not surprising that they vote in agreement more with their own caucuses. District 16, which has the lowest level of agreement of any in the state, is a classic example of a growing exurban district: it was created in 2011 out of parts of three existing districts in a fast-growing area between West Fargo and the far southwestern fringes of Fargo. Some of the existing research on multi-member districts suggests that those from heterogenous or rapidly changing areas (sudden changes in property values, housing starts, population growth/decline, etc) sometimes respond to different constituencies, since no one group or alliance of groups has been able to establish itself as the dominant political or social force in the community. The demographic data, once collected and analyzed, will hopefully shed more light on this issue.
One final note: it a common misconception of the Legislature (especially as seen in Letters to the Editor, opinion columns, blog posts, online comments, etc) that the party constituencies vote in lock-step with each other, and with their respective leadership. The tables and charts on this page have, hopefully, demonstrated the inaccuracy of that perception. One final piece of data: Majority Leader Al Carlson, in the 464 contested votes taken during this session, was only on the prevailing (winning) side 393 times (85.6%). He clearly does not have as much power to command the Republican House caucus as many would have us believe.
Polarity in the Minnesota House
Minnesota's legislative process is somewhat different from that found in its western neighbor. Actually, it would perhaps be more accurate to say that North Dakota's process is different from that of the other 49 states. North Dakota is the only legislative body (other than the New Hampshire House) which requires that every bill receive a committee hearing, committee report, and floor vote. A few states, such as Maine and Colorado, require committee hearings for each bill, and a floor vote if (and that's a major "IF") the bill receives a committee recommendation and/or report. However, these are outliers: Minnesota's process resembles much more closely that of most other states (as well as the US Congress): most of the session is dominated by committee work, where proposals for compromises and amendments are discussed, but then, near the end of the session, only certain bills are reported out of committee, and only those bills become the possible vehicles by which to implement policy.
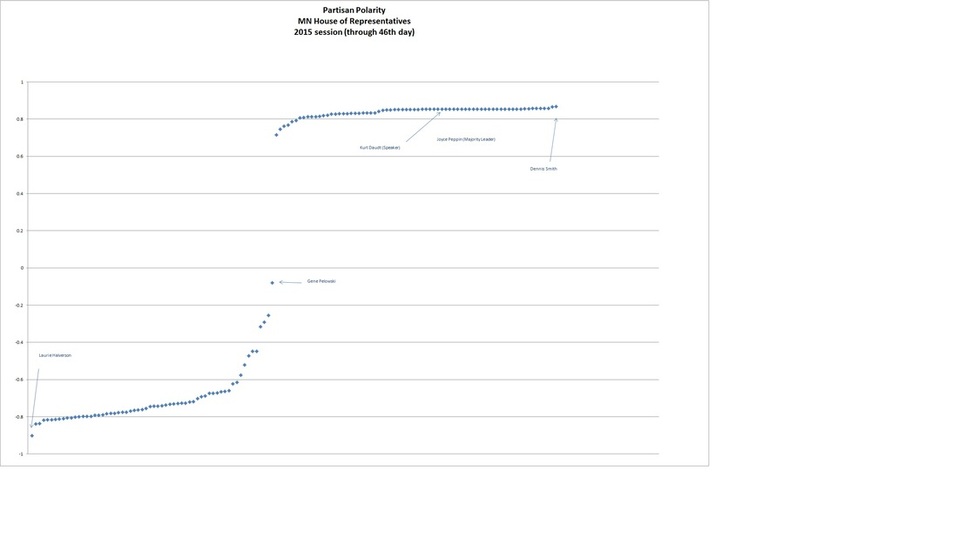
Using the same system of measurement (calculating the average percentages by which each member voted in agreement with his/her own party, and contrasting it to the average of agreement with members of the other party [scaled from -1 to +1]), we find the following "Partisan Polarity" scores through the 46th day of the 2015 session in the Minnesota House (reflecting 80 contested roll call votes):
Using the same system of measurement (calculating the average percentages by which each member voted in agreement with his/her own party, and contrasting it to the average of agreement with members of the other party [scaled from -1 to +1]), we find the following "Partisan Polarity" scores through the 46th day of the 2015 session in the Minnesota House (reflecting 80 contested roll call votes):
|
|
|
|
We can see an interesting pattern in the Minnesota House. Unlike North Dakota, which shows a wide range of partisan activity in both parties, Minnesota shows a much deeper partisan divide. Consider that the most polarized partisan members in North Dakota showed only about a 40% difference in their "levels of agreement" between the two party caucuses: in Minnesota, the differences were much starker. Particularly in the Republican caucus, there were 66 members (out of a caucus of 72) who had "partisan difference" scores of 80% or more. In the Democratic caucus, there was a bit more of a range of partisan activity, but even the average Democrat (-0.701, or 70.1%) in Minnesota behaved in a more partisan fashion than either caucus in North Dakota. These finding dovetail with those of Shor in 2013, which show Minnesota to be a much more polarized Legislature than North Dakota. The distribution graph below shows, for both caucuses (but especially for the Republicans), a much narrower band of partisan distribution.